Q3 2021: Inevitable Volatility
August 16, 2021

We’re due for some volatility. After the Covid-led drawdown in March 2020, most market pundits were expecting continued sharp up and down moves as the economy searched for stable footing . . .
...instead, strong underlying fundamentals allowed the market to march steadily higher. We are now in a period of low volatility, going 11 straight months (and counting) without a single 5% pullback.
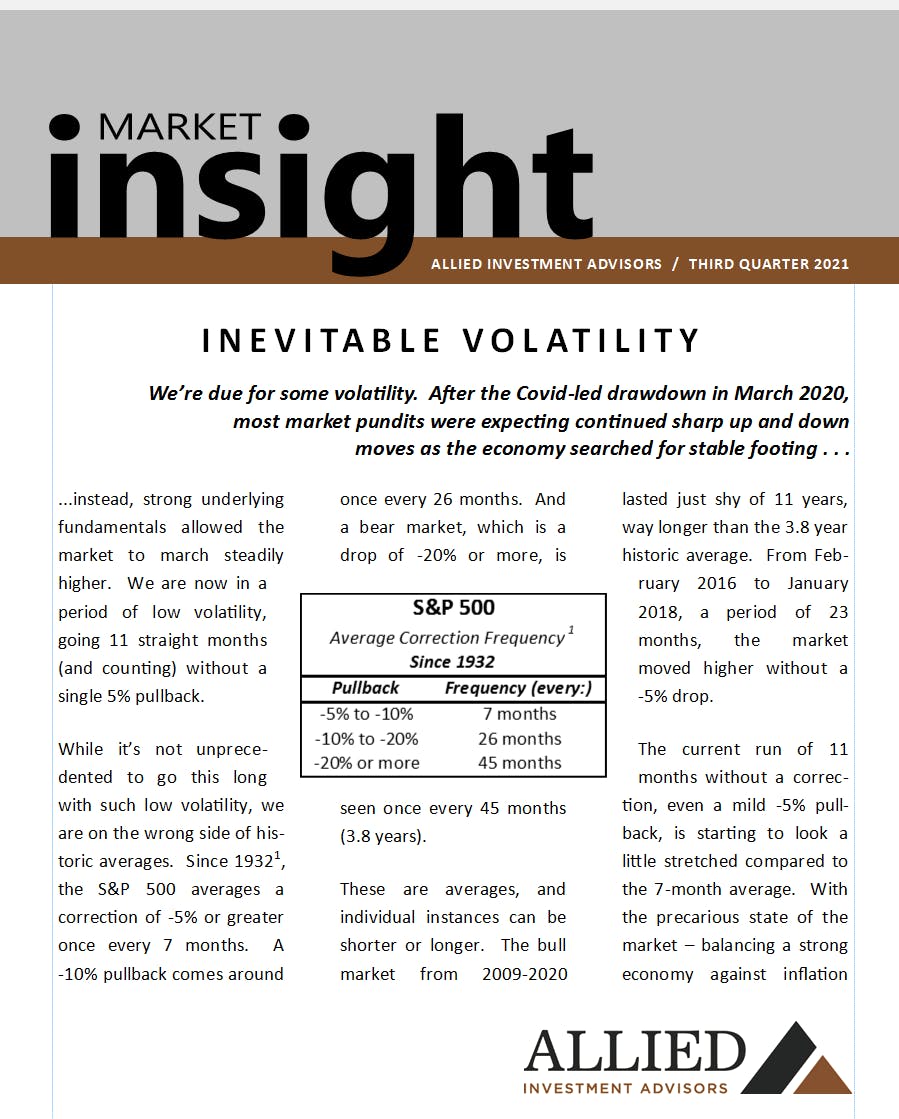
While it’s not unprecedented to go this long with such low volatility, we are on the wrong side of historic averages. Since 19321, the S&P 500 averages a correction of -5% or greater once every 7 months. A -10% pullback comes around once every 26 months. And a bear market, which is a drop of -20% or more, is seen once every 45 months (3.8 years).

These are averages, and individual instances can be shorter or longer. The bull market from 2009-2020 lasted just shy of 11 years, way longer than the 3.8 year historic average. From February 2016 to January 2018, a period of 23 months, the market moved higher without a -5% drop.
The current run of 11 months without a correction, even a mild -5% pullback, is starting to look at little stretched compared to the 7-month average. With the precarious state of market - balancing a strong economy against inflation concerns and a 4th wave of Covid - a new correction could begin at any time.

We bring this up not to scare you, but to prepare you for the next inevitable correction. Whenever that pullback does come, the best practice is to ignore it (assuming you have a long-term market outlook and an asset allocation in line with your risk tolerance – please call us if you’d like to discuss).
Peter Lynch, a noted mutual fund manager in the 1980s and author of the book, One up On Wall Street, famously quipped that “far more money has been lost by investors preparing for corrections or trying to anticipate corrections than has been lost in corrections themselves.”
To back this up, he did a study looking at two investors who bought stocks once a year for 30 straight years2. The lucky investor (also known as your brother-in-law) put their money to work on the best day each year – the annual market low. The other investor was unlucky enough to pick the worst day each year, buying when the market was at its annual high point.
"Far more money has been lost by investors preparing for corrections or trying to anticipate corrections than has been lost in corrections themselves. " Peter Lynch
We updated this study, running the analysis on the S&P 500 from 1991-2020, and found similar results to Lynch’s original 1965-1994 research. The lucky investor, with the foresight to bottom tick the market every year for 30 straight years, compounded at an annual +8.4%. This outpaced the unlucky investor and his unfortunate timing skills. But even with the headwind of buying at the high every single year for 30 straight years, the unlucky investor was still able to earn +7.4% per year over those three decades.

The difference between perfect timing and horrendous timing was 1.0%. This is similar to the results of Lynch’s original study, which showed a difference of 1.1%. Even assuming you are buying into the market the day before a correction starts, like the unlucky investor, you still would have only trailed the lucky investor by roughly 1%.
The more powerful force in the market, more powerful even than perfect timing, is compounding. Owning quality investments, through good times and bad, allows for growth not just on original principal, but on the earnings, cash flows, dividends, and interest of prior years. Timing, moving in and out of the market, breaks that chain of growth (and that’s before we get into the tax consequences). Compounding allows for the exponential growth to magnify returns over time.
Or, as Peter Lynch succinctly put it, “this timing business is much ado about very little.”
If you have any questions about your account(s), or if there has been a change in your financial situation or investment objectives, please feel free to contact any member of our team to schedule a meeting.
1 Data from January 26, 2017 TheStreet.com article “Stock Cheerleaders Love Dow 20,000.”
2 $10,000 invested annually, either at the annual market high (unlucky investor) or annual market low (lucky investor) and compounded forward. Performance calculation uses Money-Weighted Rate of Return. S&P 500 price only data, dividends not included.
The views expressed in this newsletter represent the opinion of Allied Investment Advisors, a Registered Investment Adviser. This material is for informational purposes only. It does not constitute investment advice and is not intended as an endorsement of any specific investment or services. The information provided herein is obtained from sources believed to be reliable, but no representation or warranty is made as to its accuracy or completeness. Investing in equity securities involves risks, including the potential loss of principal. While equities may offer the potential for greater long-term growth than most debt securities, they generally have higher volatility. International investments may involve risk of capital loss from unfavorable fluctuation in currency values, from differences in generally accepted accounting principles, or from economic or political instability in other nations. Past performance is not indicative of future results. Investments are not a deposit of or guaranteed by a bank or any bank affiliate. Please notify Allied Investment Advisors if there have been any changes to your financial situation or investment objectives or if you wish to impose or modify any reasonable restrictions on the management of your accounts through Allied Investment Advisors.
Resources: